If you've been thinking Denver has seen an incredible influx of millennials in recent years, you're absolutely right. A new study shows how many of them have come to Colorado and where they're moving in Denver and other major cities.
The report, from RENTCafe, sets out to discover the zip codes that are millennial strongholds in the thirty biggest U.S. cities. But at our request, the folks at the site dug deeper into the data beyond the ten Denver and Front Range zips cited in their main offering, providing a wide range of facts and figures about thirty zip codes along the urban corridor. This additional information pinpoints where millennials have been flocking in recent years — and it turns out that Westword is at ground zero of the phenomenon.
The zip code for our Golden Triangle offices, 80203, has the sixth-largest share of millennials in the United States. A stunning 66 percent of the 20,515 people who live in the area fall within the 22- to 37-year age range the site uses in its definition of millennials.
The RENTCafe figures show the overall and millennial population of each zip code in 2011 and 2016 (the most recent year available), as well as the number and percentage increase of millennials over that five-year span. And the percentages went up in all thirty of the zips, from between 7 percent and 26 percent.
Cumulatively, the number of millennials in those thirty zip codes rose by 57,862 during that half a decade, resulting in an overall millennial population of 379,956.
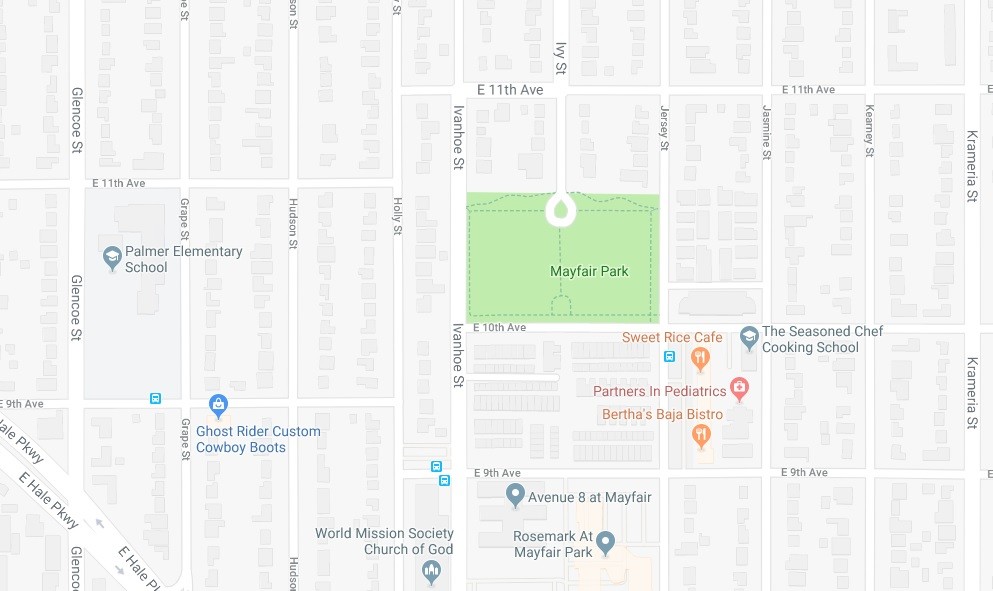
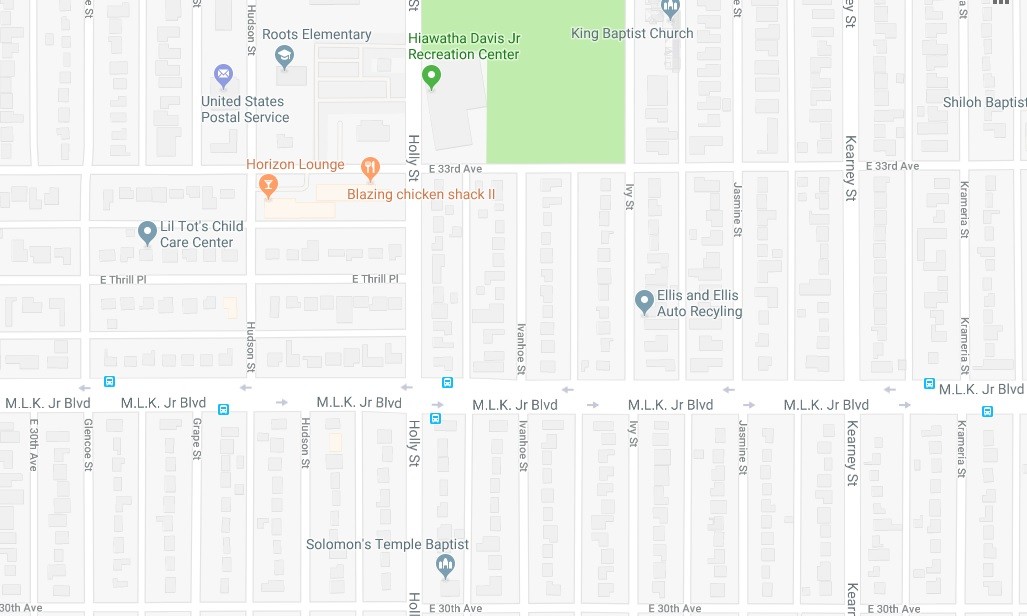
The Colorado zip codes with the most millennials by numbers are 80525, in a burgeoning portion of Fort Collins, with 17,615 people who fall into that category; 80916, not far from the Colorado Springs airport, with 14,970; 80205, which encompasses Denver's Whittier neighborhood, with 14,948; 80231, a Denver zip in the vicinity of the Indian Creek neighborhood, with 13,958; and 80211, a chunk of Denver's Highland neighborhood, with 13,560.
The biggest change in millennial population from 2011-2016? The winner is the aforementioned 80205, with 4,875 more millennials moving in, followed by Aurora's 80016, at 3,482; Green Valley Ranch-centric 80249, with 3,449, and the previously noted Golden Triangle zip 80203, with 3,062. And after 80203's 66 percent millennial population, the highest finishers are 80202, a lower downtown zip, at 57 percent; 80218, around the Country Club neighborhood, at 52 percent; and 80205, at 46 percent.
Oh, yeah: Seven of the ten most millennial-heavy zips in Colorado are in Denver — and four Mile High City zips (80206, 80209, 80224 and 80237) are among the twenty fastest-growing in the country when it comes to millennials.
That's a lot of hipsters. Continue to count down the thirty Colorado zip codes with the greatest growth in the share of millennials.
Number 30: 80241 — Thornton
Population 2016: 33,760
Millennials 2016: 9,827
Share of Millennials 2016: 29 percent
Population 2011: 31,605
Millennials 2011: 8,629
Share of Millennials 2011: 27 percent
Millennial Population Change 2011-2016: 1,198
Change in Share 2011-2016: +7 percent
Number 29: 80911 — Colorado Springs
Population 2016: 32,530
Millennials 2016: 9,290
Share of Millennials 2016: 29 percent
Population 2011: 30,385
Millennials 2011: 8,059
Share of Millennials 2011: 27 percent
Millennial Population Change 2011-2016: 1,231
Change in Share 2011-2016: +8 percent
Number 28: 80524 — Fort Collins
Population 2016: 33,575
Millennials 2016: 10,998
Share of Millennials 2016: 33 percent
Population 2011: 32,386
Millennials 2011: 9,842
Share of Millennials 2011: 30 percent
Millennial Population Change 2011-2016: 1,156
Change in Share 2011-2016: +8 percent
Number 27: 80910 — Colorado Springs
Population 2016: 30,749
Millennials 2016: 10,839
Share of Millennials 2016: 35 percent
Population 2011: 28,086
Millennials 2011: 9,140
Share of Millennials 2011: 33 percent
Millennial Population Change 2011-2016: 1,699
Change in Share 2011-2016: +8 percent
Number 26: 80905 — Colorado Springs
Population 2016: 18,314
Millennials 2016: 6,055
Share of Millennials 2016: 33 percent
Population 2011: 15,875
Millennials 2011: 4,841
Share of Millennials 2011: 30 percent
Millennial Population Change 2011-2016: 1,214
Change in Share 2011-2016: +8 percent
Number 25: 80220 — Denver
Population 2016: 35,715
Millennials 2016: 11,990
Share of Millennials 2016: 34 percent
Population 2011: 33,129
Millennials 2011: 10,257
Share of Millennials 2011: 31 percent
Millennial Population Change 2011-2016: 1,733
Change in Share 2011-2016: +8 percent
Number 24: 80525 — Fort Collins
Population 2016: 52,612
Millennials 2016: 17,615
Share of Millennials 2016: 33 percent
Population 2011: 47,295
Millennials 2011: 14,591
Share of Millennials 2011: 31 percent
Millennial Population Change 2011-2016: 3,024
Change in Share 2011-2016: +9 percent
Number 23: 80016 — Aurora
Population 2016: 49,384
Millennials 2016: 11,590
Share of Millennials 2016: 23 percent
Population 2011: 37,499
Millennials 2011: 8,108
Share of Millennials 2011: 22 percent
Millennial Population Change 2011-2016: 3,482
Change in Share 2011-2016: +9 percent
Number 22: 80030 — Westminster
Population 2016: 16,293
Millennials 2016: 5,109
Share of Millennials 2016: 31 percent
Population 2011: 15,895
Millennials 2011: 4,559
Share of Millennials 2011: 29 percent
Millennial Population Change 2011-2016: 550
Change in Share 2011-2016: +9 percent
Number 21: 80923 — Colorado Springs
Population 2016: 28,192
Millennials 2016: 9,256
Share of Millennials 2016: 33 percent
Population 2011: 25,999
Millennials 2011: 7,804
Share of Millennials 2011: 30 percent
Millennial Population Change 2011-2016: 1,452
Change in Share 2011-2016: +9 percent
Number 20: 80207 — Denver
Population 2016: 25,343
Millennials 2016: 7,882
Share of Millennials 2016: 31 percent
Population 2011: 20,252
Millennials 2011: 5,679
Share of Millennials 2011: 28 percent
Millennial Population Change 2011-2016: 2,203
Change in Share 2011-2016: +11 percent
Number 19: 80916 — Colorado Springs (Peterson Air Force Base)
Population 2016: 38,837
Millennials 2016: 14,970
Share of Millennials 2016: 39 percent
Population 2011: 35,520
Millennials 2011: 12,283
Share of Millennials 2011: 35 percent
Millennial Population Change 2011-2016: 2.687
Change in Share 2011-2016: +11 percent
Number 18: 80230 — Denver
Population 2016: 8,491
Millennials 2016: 2,679
Share of Millennials 2016: 32 percent
Population 2011: 7,888
Millennials 2011: 2,219
Share of Millennials 2011: 28 percent
Millennial Population Change 2011-2016: 460
Change in Share 2011-2016: +12 percent
Number 17: 80222 — Denver
Population 2016: 21,272
Millennials 2016: 7,152
Share of Millennials 2016: 34 percent
Population 2011: 19,512
Millennials 2011: 5,845
Share of Millennials 2011: 30 percent
Millennial Population Change 2011-2016: 1,307
Change in Share 2011-2016: +12 percent
Number 16: 80231 — Denver
Population 2016: 35,910
Millennials 2016: 13,958
Share of Millennials 2016: 39 percent
Population 2011: 31,947
Millennials 2011: 10,985
Share of Millennials 2011: 34 percent
Millennial Population Change 2011-2016: 2,973
Change in Share 2011-2016: +13 percent
Number 15: 80922 — Colorado Springs
Population 2016: 28,066
Millennials 2016: 9,183
Share of Millennials 2016: 33 percent
Population 2011: 26,325
Millennials 2011: 7,599
Share of Millennials 2011: 29 percent
Millennial Population Change 2011-2016: 1,584
Change in Share 2011-2016: +13 percent
Number 14: 80304 — Boulder
Population 2016: 26,732
Millennials 2016: 7,981
Share of Millennials 2016: 30 percent
Population 2011: 25,110
Millennials 2011: 6,591
Share of Millennials 2011: 26 percent
Millennial Population Change 2011-2016: 1,390
Change in Share 2011-2016: +14 percent
Number 13: 80203 — Denver
Population 2016: 20,515
Millennials 2016: 13,489
Share of Millennials 2016: 66 percent
Population 2011: 18,125
Millennials 2011: 10,427
Share of Millennials 2011: 58 percent
Millennial Population Change 2011-2016: 3,062
Change in Share 2011-2016: +14 percent
Number 12: 80218— Denver
Population 2016: 18,786
Millennials 2016: 9,678
Share of Millennials 2016: 52 percent
Population 2011: 18,420
Millennials 2011: 8,283
Share of Millennials 2011: 45 percent
Millennial Population Change 2011-2016: 1,395
Change in Share 2011-2016: +15 percent
Number 11: 80909 — Colorado Springs
Population 2016: 38,262
Millennials 2016: 11,846
Share of Millennials 2016: 31 percent
Population 2011: 34,973
Millennials 2011: 9,435
Share of Millennials 2011: 27 percent
Millennial Population Change 2011-2016: 2,411
Change in Share 2011-2016: +15 percent
Number 10: 80223 — Denver
Population 2016: 19,674
Millennials 2016: 7,145
Share of Millennials 2016: 36 percent
Population 2011: 16,528
Millennials 2011: 5,222
Share of Millennials 2011: 32 percent
Millennial Population Change 2011-2016: 1,923
Change in Share 2011-2016: +15 percent
Number 9: 80214 — Denver
Population 2016: 25,252
Millennials 2016: 9,055
Share of Millennials 2016: 36 percent
Population 2011: 25,143
Millennials 2011: 7,774
Share of Millennials 2011: 31 percent
Millennial Population Change 2011-2016: 1,281
Change in Share 2011-2016: +16 percent
Number 8: 80202 — Denver
Population 2016: 12,643
Millennials 2016: 7,176
Share of Millennials 2016: 57 percent
Population 2011: 9,133
Millennials 2011: 4,434
Share of Millennials 2011: 49 percent
Millennial Population Change 2011-2016: 2,742
Change in Share 2011-2016: +17 percent
Number 7: 80211 — Denver
Population 2016: 33,258
Millennials 2016: 13,560
Share of Millennials 2016: 41 percent
Population 2011: 31,798
Millennials 2011: 11,028
Share of Millennials 2011: 35 percent
Millennial Population Change 2011-2016: 2,532
Change in Share 2011-2016: +18 percent
Number 6: 80007 — Arvada
Population 2016: 8,691
Millennials 2016: 1,714
Share of Millennials 2016: 20 percent
Population 2011: 6,996
Millennials 2011: 1,143
Share of Millennials 2011: 16 percent
Millennial Population Change 2011-2016: 571
Change in Share 2011-2016: +21 percent
Number 5: 80004 — Arvada
Population 2016: 37,152
Millennials 2016: 9,510
Share of Millennials 2016: 26 percent
Population 2011: 35,769
Millennials 2011: 7,556
Share of Millennials 2011: 21 percent
Millennial Population Change 2011-2016: 1,954
Change in Share 2011-2016: +21 percent
Number 4: 80951 — Colorado Springs
Population 2016: 4.103
Millennials 2016: 1,803
Share of Millennials 2016: 45 percent
Population 2011: 4,156
Millennials 2011: 1,517
Share of Millennials 2011: 37 percent
Millennial Population Change 2011-2016: 286
Change in Share 2011-2016: +23 percent
Number 3: 80238 — Denver
Population 2016: 14,854
Millennials 2016: 4,289
Share of Millennials 2016: 29 percent
Population 2011: 9,651
Millennials 2011: 2,251
Share of Millennials 2011: 23 percent
Millennial Population Change 2011-2016: 2,038
Change in Share 2011-2016: +24 percent
Number 2: 80205 — Denver
Population 2016: 32,526
Millennials 2016: 14,948
Share of Millennials 2016: 46 percent
Population 2011: 27,415
Millennials 2011: 10,073
Share of Millennials 2011: 37 percent
Millennial Population Change 2011-2016: 4,875
Change in Share 2011-2016: +25 percent
Number 1: 80249 — Denver
Population 2016: 29,024
Millennials 2016: 9,369
Share of Millennials 2016: 32 percent
Population 2011: 23,103
Millennials 2011: 5,920
Share of Millennials 2011: 26 percent
Millennial Population Change 2011-2016: 3,449
Change in Share 2011-2016: +26 percent

Halfpoint/iStock
[
        {
          "name": "Air - MediumRectangle - Inline Content - Mobile Display Size",
          "component": "12017618",
          "insertPoint": "2",
          "requiredCountToDisplay": "2"
        },{
          "name": "Editor Picks",
          "component": "17242653",
          "insertPoint": "4",
          "requiredCountToDisplay": "1"
        },{
          "name": "Inline Links",
          "component": "18838239",
          "insertPoint": "8th",
          "startingPoint": 8,
          "requiredCountToDisplay": "7",
          "maxInsertions": 25
        },{
          "name": "Air - MediumRectangle - Combo - Inline Content",
          "component": "17261320",
          "insertPoint": "8th",
          "startingPoint": 8,
          "requiredCountToDisplay": "7",
          "maxInsertions": 25
        },{
          "name": "Inline Links",
          "component": "18838239",
          "insertPoint": "8th",
          "startingPoint": 12,
          "requiredCountToDisplay": "11",
          "maxInsertions": 25
        },{
          "name": "Air - Leaderboard Tower - Combo - Inline Content",
          "component": "17261321",
          "insertPoint": "8th",
          "startingPoint": 12,
          "requiredCountToDisplay": "11",
          "maxInsertions": 25
        }
      ]


BEFORE YOU GO...
Can you help us continue to share our stories? Since the beginning, Westword has been defined as the free, independent voice of Denver — and we'd like to keep it that way. Our members allow us to continue offering readers access to our incisive coverage of local news, food, and culture with no paywalls.
Can you help us continue to share our stories? Since the beginning, Westword has been defined as the free, independent voice of Denver — and we'd like to keep it that way. Our members allow us to continue offering readers access to our incisive coverage of local news, food, and culture with no paywalls.


Trending


Use of this website constitutes acceptance of our
terms of use,
our cookies policy, and our
privacy policy
Westword may earn a portion of sales from products & services purchased through links on our site from our
affiliate partners.
©2024
Denver Westword, LLC. All rights reserved.
Do Not Sell or Share My Information
Do Not Sell or Share My Information
