Here are the most recent numbers, updated at 4:30 p.m. on January 31. We've included a new category — variant cases confirmed in Colorado to date — and juxtaposed all of the stats with those released on January 24, highlighted in last week's roundup about the novel coronavirus.
Cases 396,179 (up 9,894 from January 24)Four major takeaways:
Variant cases 12 (up 2 from January 24)
Total hospitalized 21,833 (up 596 from January 24)
Counties 64 (unchanged from January 24)
Deaths among cases 5,637 (up 132 from January 24)
Deaths due to COVID-19 4,928 (up 219 from January 24)
Total outbreaks 3,502 (up 100 from January 24)
• New COVID-19 cases for the past week are under 10,000 for the first time in months. The average weekly hike from December 13 through January 4 was 17,686 and the number jumped to 19,898 on January 10, but it's been sliding since then; it was 11,304 for the week ending on January 24. As for those variant cases, they've risen, but not by much — from 10 on January 24 to 12 on January 31.
• Hospitalizations are up from 550 on January 24 to 596 this week, but that appears to be a slight blip in an overall downward trajectory. The average count between December 13 and January 4 was 862, with a leap of 1,272 leading to January 10. New hospitalizations dipped back down to 702 on January 17, and fell further over the next seven days.
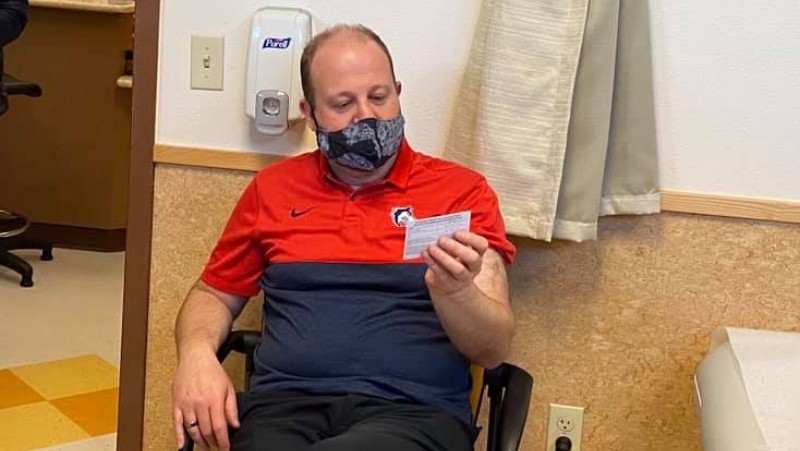
• Deaths directly attributable to COVID-19 edged up from 207 on January 24 to 219 on January 31. As Governor Jared Polis (who received his first vaccination shot on Saturday, January 30) has repeatedly emphasized, there are more tragedies from the disease ahead of us, and there will be for many months to come.
• New outbreaks tumbled from 126 on January 24 to 100, but this statistic is extremely fluid. The January 20 outbreaks report boasted just 72 new entries, the first week that was under triple digits since October, but it flared right back up to 140 on January 27.
Here's a look at daily cases of COVID-19 as reported to state public health officials at the end of January. Note that the 1,036 registered on January 30, the most recent date available, is more than 40 percent lower than the high-water mark of 1,891 on January 22, but a bit above the lowest point of late: 901 on January 25.
January 30, 2021 — 1,036 Cases
January 29, 2021 — 1,406 Cases
January 28, 2021 — 1,612 Cases
January 27, 2021 — 1,477 Cases
January 26, 2021 — 1,413 Cases
January 25, 2021 — 901 Cases
January 24, 2021 — 1,192 Cases
January 23, 2021 — 1,339 Cases
January 22, 2021 — 1,891 Cases
January 21, 2021 — 1,777 Cases
More good news: The seven-day average positivity rate, defined by the Bloomberg School of Public Health at Johns Hopkins as "the percentage of all coronavirus tests performed that are actually positive, or: (positive tests)/(total tests) x 100 percent," remains a bit under the 5 percent threshold recommended by most experts, at 4.91 percent; it was 4.92 percent on January 24. And while the percentage of previous week outpatient syndromic COVID visits climbed slightly, from 3.95 percent on January 24 to the present 4.29 percent, the stat is around a quarter of what it was just a couple of months ago.
The overall number of patients hospitalized for the disease over the past ten days fell even more precipitously. On January 24, the daily average was around 800 over a ten-day period, but for the last three days, it's been under 700. New daily hospital admissions are down, too, with a particular bright spot on January 30, when the boost was just 27 patients statewide.
Patients Currently Hospitalized for COVID-19
January 31, 2021
611 Total COVID Patients (Confirmed & Suspected/PUI)
558 (91 percent) Confirmed COVID-19
53 (9 percent) Persons Under Investigation
January 30, 2021
648 Total COVID Patients (Confirmed & Suspected/PUI)
583 (90 percent) Confirmed COVID-19
65 (10 percent) Persons Under Investigation
January 29, 2021
652 Total COVID Patients (Confirmed & Suspected/PUI)
596 (91 percent) Confirmed COVID-19
56 (9 percent) Persons Under Investigation
January 28, 2021
702 Total COVID Patients (Confirmed & Suspected/PUI)
644 (92 percent) Confirmed COVID-19
58 (8 percent) Persons Under Investigation
January 27, 2021
724 Total COVID Patients (Confirmed & Suspected/PUI)
662 (91 percent) Confirmed COVID-19
62 (9 percent) Persons Under Investigation
January 26, 2021
740 Total COVID Patients (Confirmed & Suspected/PUI)
674 (91 percent) Confirmed COVID-19
66 (9 percent) Persons Under Investigation
January 25, 2021
706 Total COVID Patients (Confirmed & Suspected/PUI)
644 (91 percent) Confirmed COVID-19
62 (9 percent) Persons Under Investigation
January 24, 2021
737 Total COVID Patients (Confirmed & Suspected/PUI)
696 (94 percent) Confirmed COVID-19
41 (6 percent) Persons Under Investigation
January 23, 2021
716 Total COVID Patients (Confirmed & Suspected/PUI)
679 (95 percent) Confirmed COVID-19
37 (5 percent) Persons Under Investigation
January 22, 2021
772 Total COVID Patients (Confirmed & Suspected/PUI)
708 (92 percent) Confirmed COVID-19
64 (8 percent) Persons Under Investigation
New Hospital Admissions by Admission Date
January 31, 2021
59 patients admitted to the hospital
77 seven-day average of patients admitted to the hospital
January 30, 2021
27 patients admitted to the hospital
87 seven-day average of patients admitted to the hospital
January 29, 2021
58 patients admitted to the hospital
91 seven-day average of patients admitted to the hospital
January 28, 2021
78 patients admitted to the hospital
100 seven-day average of patients admitted to the hospital
January 27, 2021
93 patients admitted to the hospital
100 seven-day average of patients admitted to the hospital
January 26, 2021
147 patients admitted to the hospital
107 seven-day average of patients admitted to the hospital
January 25, 2021
76 patients admitted to the hospital
101 seven-day average of patients admitted to the hospital
January 24, 2021
128 patients admitted to the hospital
102 seven-day average of patients admitted to the hospital
January 23, 2021
59 patients admitted to the hospital
99 seven-day average of patients admitted to the hospital
January 22, 2021
119 patients admitted to the hospital
105 seven-day average of patients admitted to the hospital
All of these factors have contributed to the CDPHE's decision to adjust the dial. In late December, Polis suddenly announced that all Level Red counties would be shifted to Level Orange on January 4, and that was hardly the first time the state has moved the goal posts with little or no warning.
This time around, though, the CDPHE is soliciting the public's comments — but the window is very tight. The invitation to weigh in was announced at 2:29 p.m. on January 31, just over 24 hours prior to the deadline of 5 p.m. today, February 1.
These are the department's explanations of significant draft changes:
• An increase in the range of incidence metrics for all colors to better balance disease suppression with economic hardship, while preventing a breach in hospital capacity.Click to review the draft and submit feedback.
• Moving to a seven-day metric of incidence rate, percent positivity of testing, and hospitalizations instead of a 14 day metric to more quickly respond to local conditions
• Decreasing the metric requirement for testing positivity rates in the yellow and orange levels to continue to promote testing as an important disease containment strategy.
• Special consideration from CDPHE for counties under 20,000 population to determine the level on the dial, accounting for weekly variability in the percent positivity of tests and disease incidence rates.